The data-set we will be using for this post relates to the paper here. The article is from the group of Bruce Baguley who has written some fantastic papers on the cell-cycle times of cancer cells from patient samples over the years. (The data can be found here together with code relating to this post.)
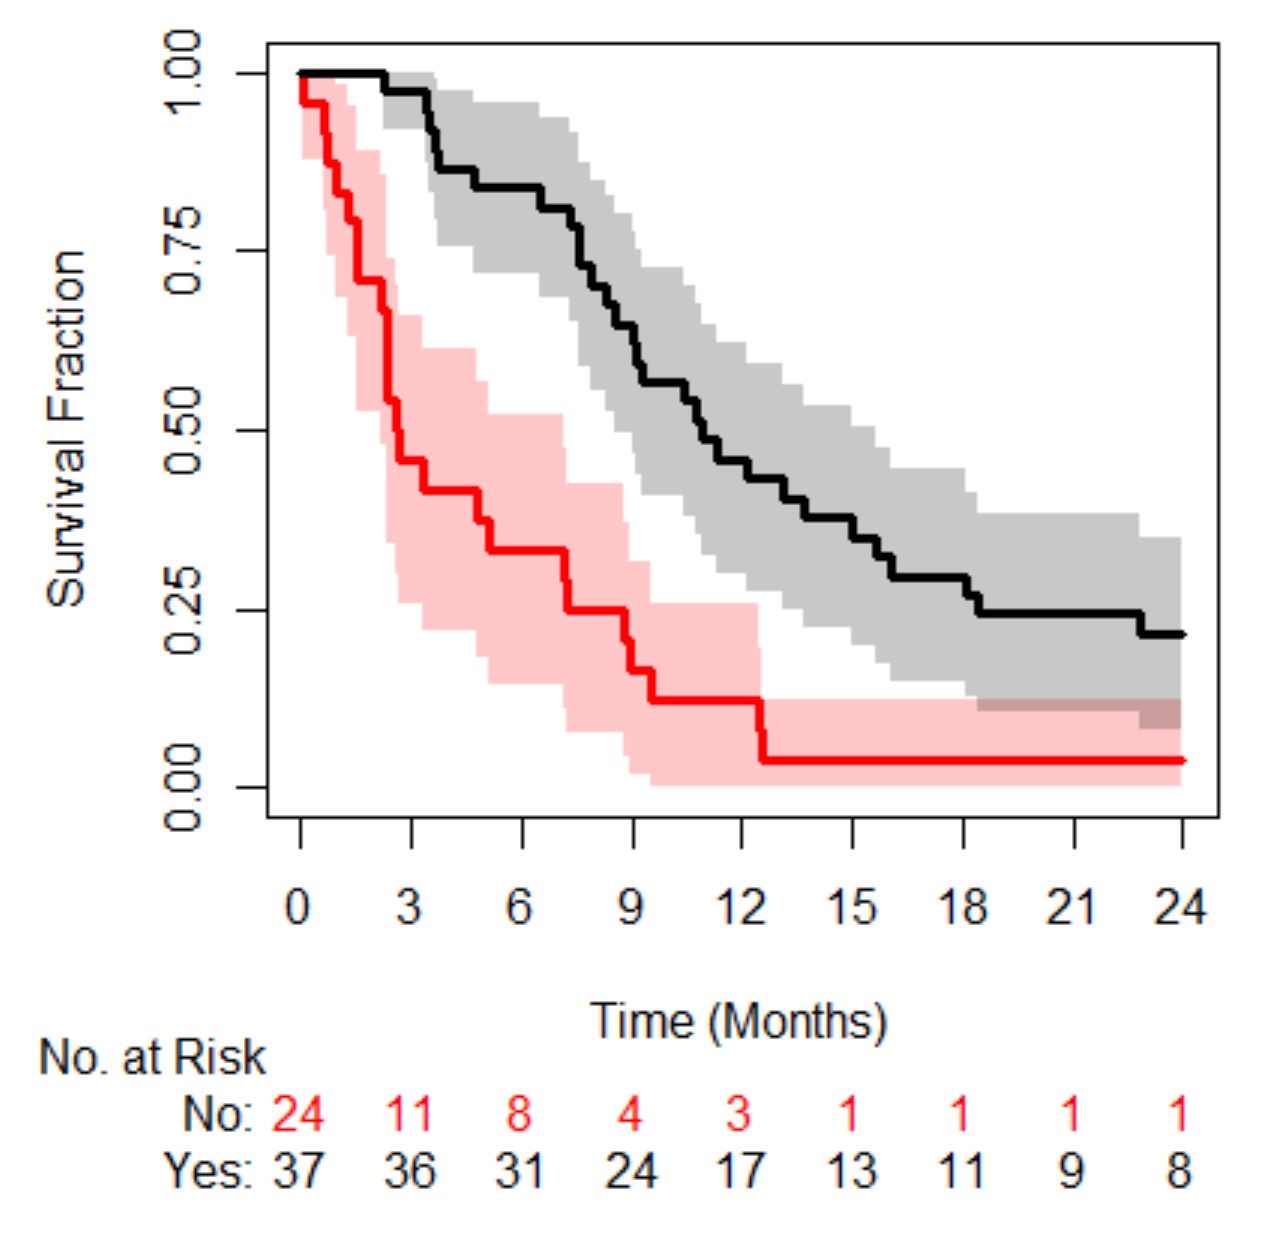
In the data-set we have information on the culture cell cycle times for each patient’s sample, whether they had radiotherapy or not, and the patient’s survival times. (Note, this study was done long before numerous people had written about sample size calculations for multivariable survival analyses.) In total we have 70 patients all of whom had an event and the median survival was approximately 8 months. Of the 70 patients 37 had radiotherapy, 24 did not and for 9 we have no information. Just before we launch into the survival analysis and get overly excited, it’s worth noting the following…
There are numerous prognostic factors which have not been collected in this study, some are known now but weren’t known when this study was performed. This is an important point and should never be overlooked. Some of these known/unknown prognostic factors may well correlate with cell-cycle times and these may not need a tissue sample i.e. they could be really easy to measure. We shall come back to this point at the end of the post.
In the code provided you will see that we first build a survival model using radiotherapy as a covariate and find that there is a survival difference, those that have radiotherapy (black line in figure below) live longer than those that don’t (red line in figure below). (Let’s throw in a p-value to make certain readers happy, p<0.001.) So, we have a treatment effect.
We next assess whether in addition to the treatment effect cell-cycle times also correlate with survival. So, we add that to the model and lo and behold that improves our correlation to survival over a model with just radiotherapy, based on the likelihood ratio-test. What we really care about though is the interaction between treatment and cell-cycle times… hold your breath…there does seem to be an interaction (see code here) – everyone cheers with delight. (Note, you may want to use splines – the relationship between log(hazard) and biomarkers can be non-linear, it probably is; recall the Circulating Tumour Cell story here.)
A simple way of looking at an interaction could be to simply plot survival probabilities, at a certain time-point, as a function of the biomarker, with and without radiotherapy, see below (red is no radiotherapy and black is with radiotherapy). (In the code you will also find a calibration plot showing how well the model describes the data at 6 months.)
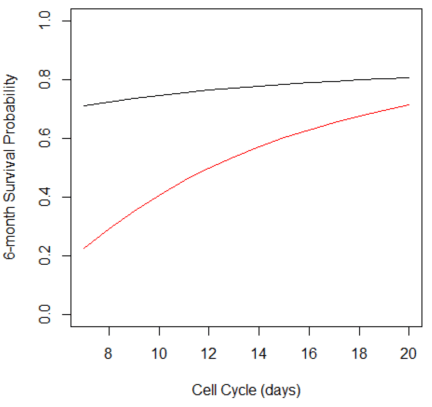
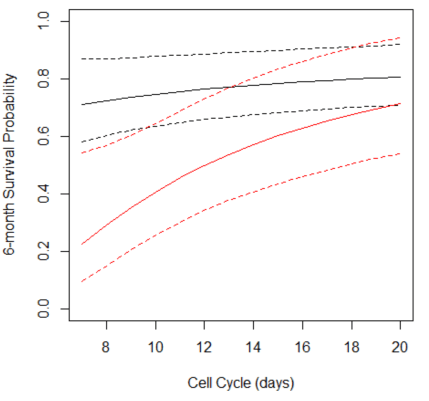
Two plots are displayed on purpose, the one on the left is the point estimate only and the one on the right includes the 95% confidence interval (dashed lines). What the plot shows is that the survival benefit of radiotherapy becomes less certain with increasing cell-cycle times. To some people this is what you would expect – the benefit of RT to be dependent on cell-cycle times. (If you do a search for radiotherapy and cell-cycle you will start to understand the reasons why.) How does seeing the confidence interval affect your interpretation? What if I also mention the cell-cycle times come with a low degree of precision. These uncertainties may play an even bigger role when thinking about personalising dose…
Although information on what the radiotherapy dose is not available it is likely that all the patients had the same dose. (It’s a single center study.) Therefore, the plot shown above we could argue is for a dose of 0 (black line) and another dose unspecified (red line), so we have two “points” on a dose-response curve. That’s clearly not enough. That is, we don’t really know what the benefit of radiotherapy is over no therapy at say either a lower or higher dose across the cell-cycle range without more data.
If we could generate more data what would be useful is a plot that shows the gain in survival, say at a fixed time-point of interest, for different doses and cell-cycle times and a corresponding plot for toxicities of interest. Such that as a patient I could see what the cost is to me – what am I prepared to endure and also how uncertain are these estimates. I wonder if we were to account for uncertainty the predicted dose would become a predicted dose-range and it may actually include the current standard dose for all patients mightn’t it? Finally, …
There are numerous technical issues too, can we get good samples, what are the patient characteristics for those we can’t compare to those we can? How easy is the assay to run – could I do it in the Outer Hebrides? Maybe we also want to consider certain confounders – what would be a big one for cell-cycle time? Maybe tumour volume? Hmmm…